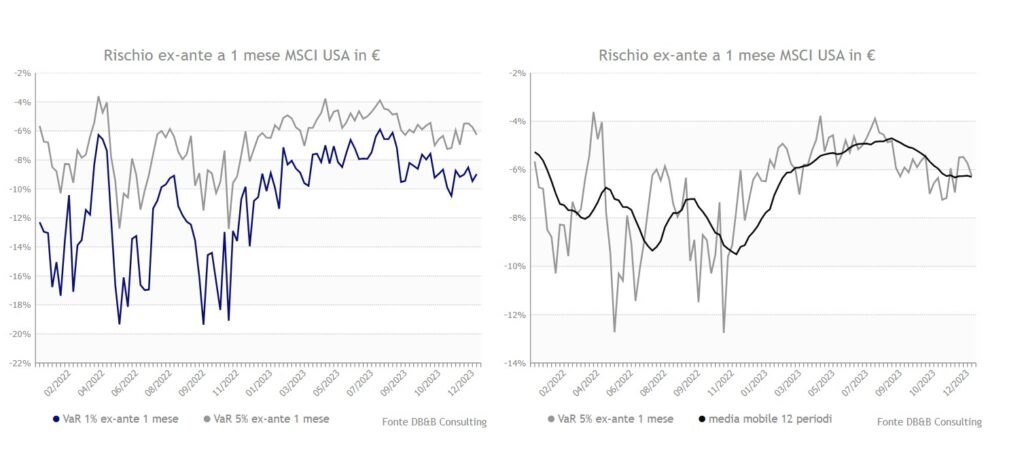
Il grafico mostra l’andamento del Var 1% e Var 5% dal Luglio 2022, fino al 29 Dicembre 2023 dell’indice MSCI USA.
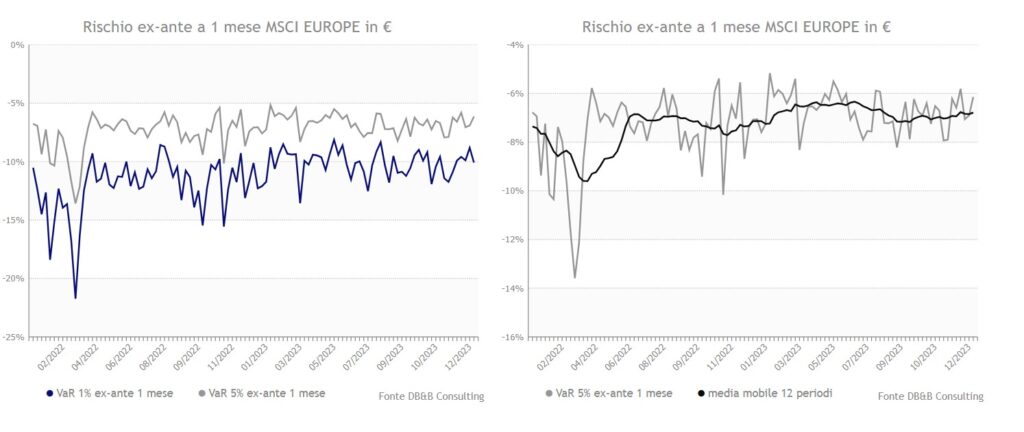
Il grafico mostra l’andamento del Var 1% e Var 5% dal Luglio 2022, fino al 29 Dicembre 2023 dell’indice europeo MSCI EUR.
La tendenza è di consolidamento del livello di rischio iniziata a Settembre
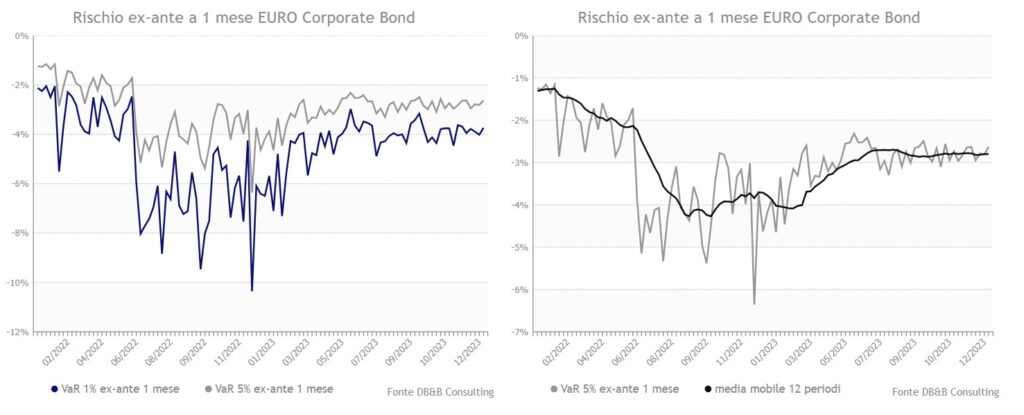
Il grafico mostra l’andamento del Var 1% e Var 5% dal Luglio 2022, fino al 29 Dicembre 2023 dell’indice europeo EUR Corporate Bond.
Si nota un consolidamento del livello di rischio.
Come le sanzioni economiche colpiscono la Germania. Marzo 2022...
La Transizione Energetica Globale Un’Analisi del Panorama Attuale Nel panorama attuale, la pol...
Errore: Modulo di contatto non trovato.
Cookie | Durata | Descrizione |
---|---|---|
cookielawinfo-checkbox-analytics | 11 months | This cookie is set by GDPR Cookie Consent plugin. The cookie is used to store the user consent for the cookies in the category "Analytics". |
cookielawinfo-checkbox-functional | 11 months | The cookie is set by GDPR cookie consent to record the user consent for the cookies in the category "Functional". |
cookielawinfo-checkbox-necessary | 11 months | This cookie is set by GDPR Cookie Consent plugin. The cookies is used to store the user consent for the cookies in the category "Necessary". |
cookielawinfo-checkbox-others | 11 months | This cookie is set by GDPR Cookie Consent plugin. The cookie is used to store the user consent for the cookies in the category "Other. |
cookielawinfo-checkbox-performance | 11 months | This cookie is set by GDPR Cookie Consent plugin. The cookie is used to store the user consent for the cookies in the category "Performance". |
viewed_cookie_policy | 11 months | The cookie is set by the GDPR Cookie Consent plugin and is used to store whether or not user has consented to the use of cookies. It does not store any personal data. |